Sent automatically
No login required - your report arrives on a set schedule with no action needed on your end.
Reporting
Access all the data you need to measure performance. Reports can also be exported in various formats for additional analysis.
The demo instance below provides you with a sample of the types of reports that are available within the Fulcrum reporting environment.
The reports
Plus funnel, journey, and experiment reporting, all in the same dashboard.
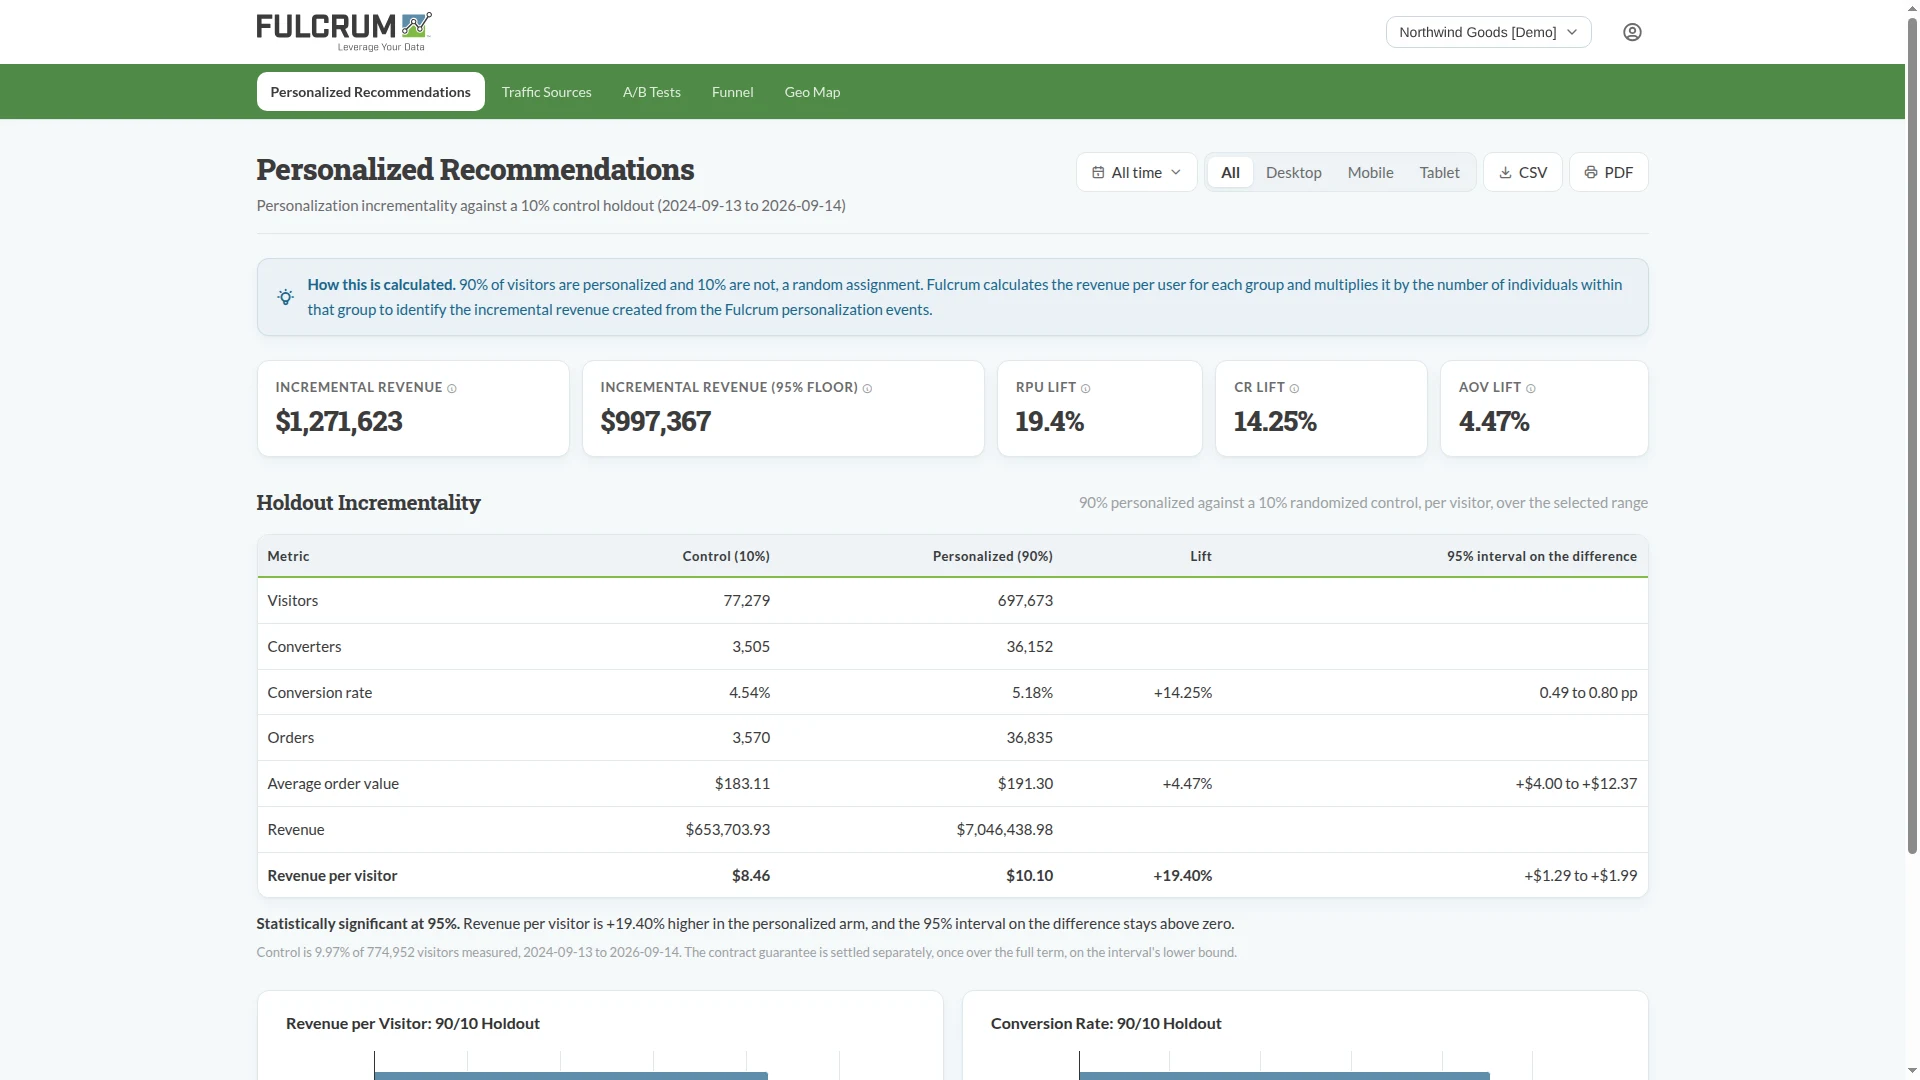 Personalized Recommendations
View larger
Personalized Recommendations
View larger
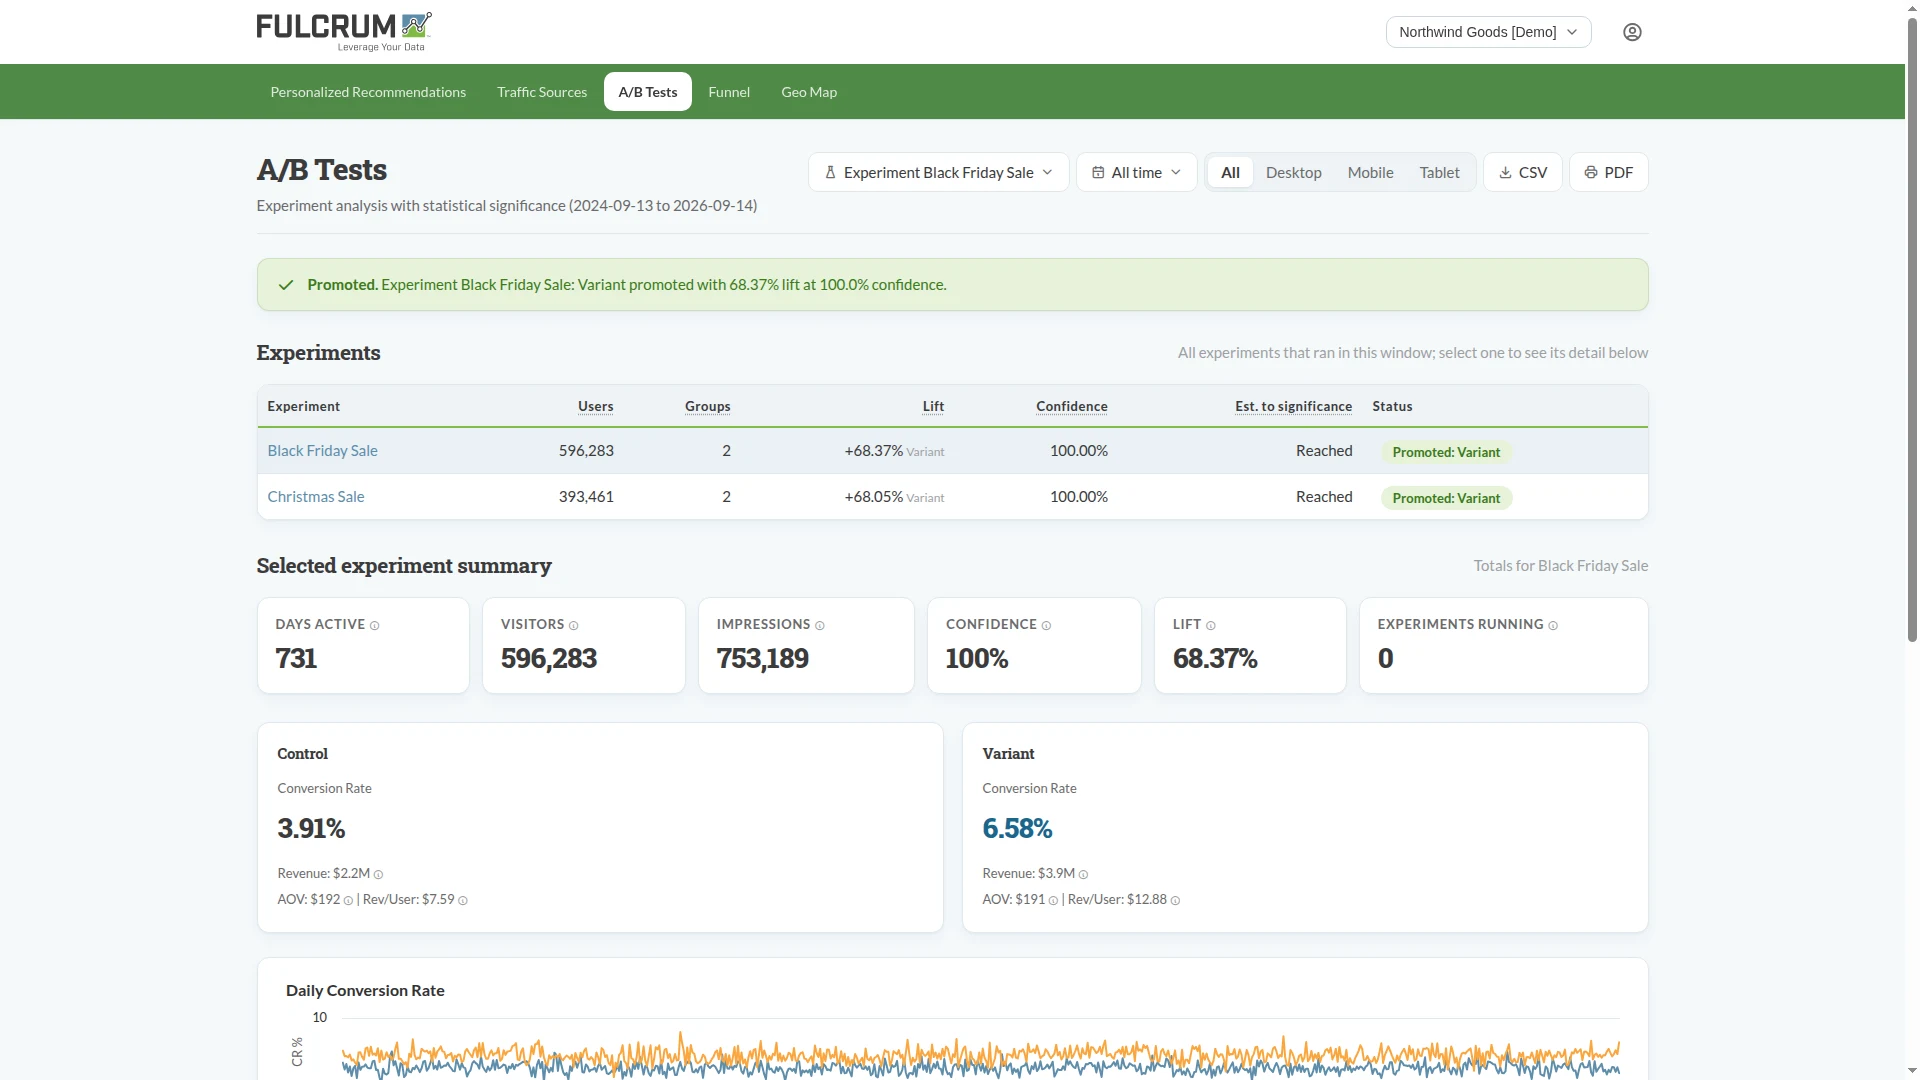 A/B Tests
View larger
A/B Tests
View larger
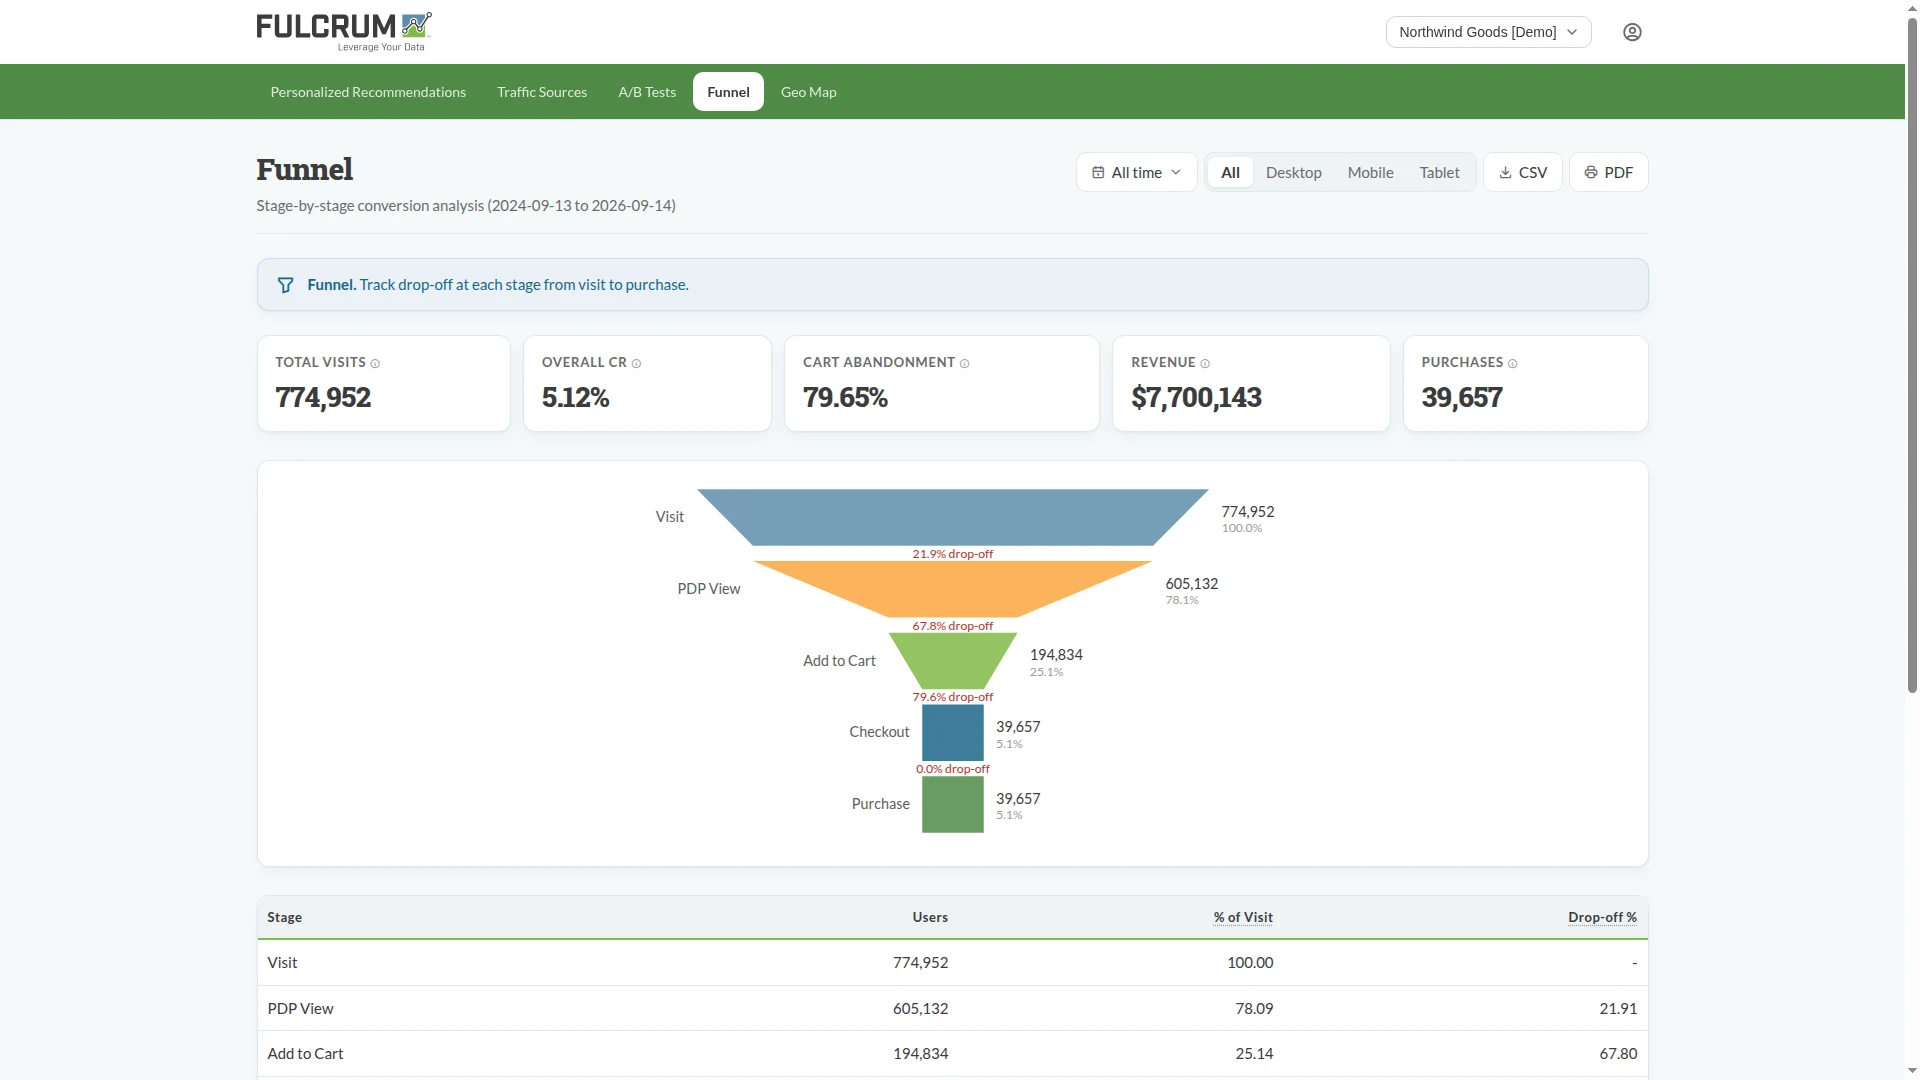 Funnel
View larger
Funnel
View larger
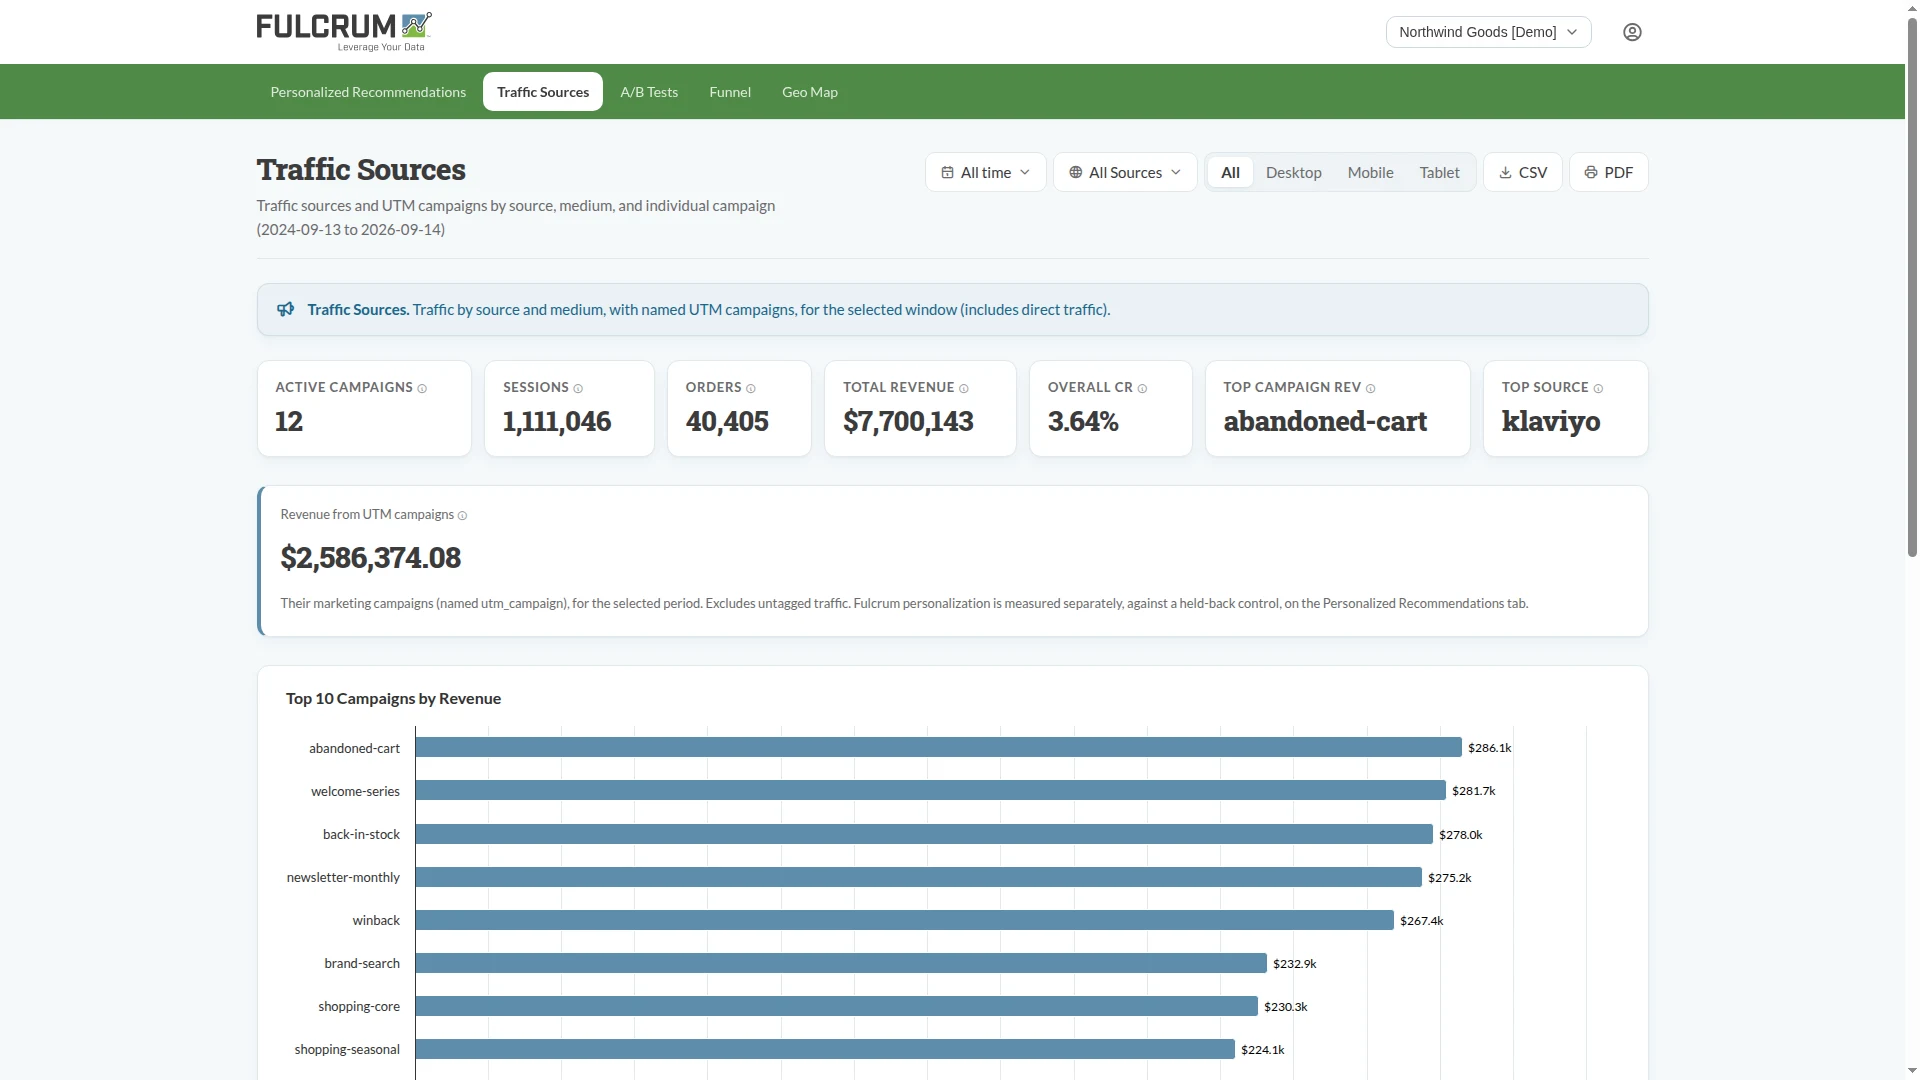 Traffic Sources
View larger
Traffic Sources
View larger
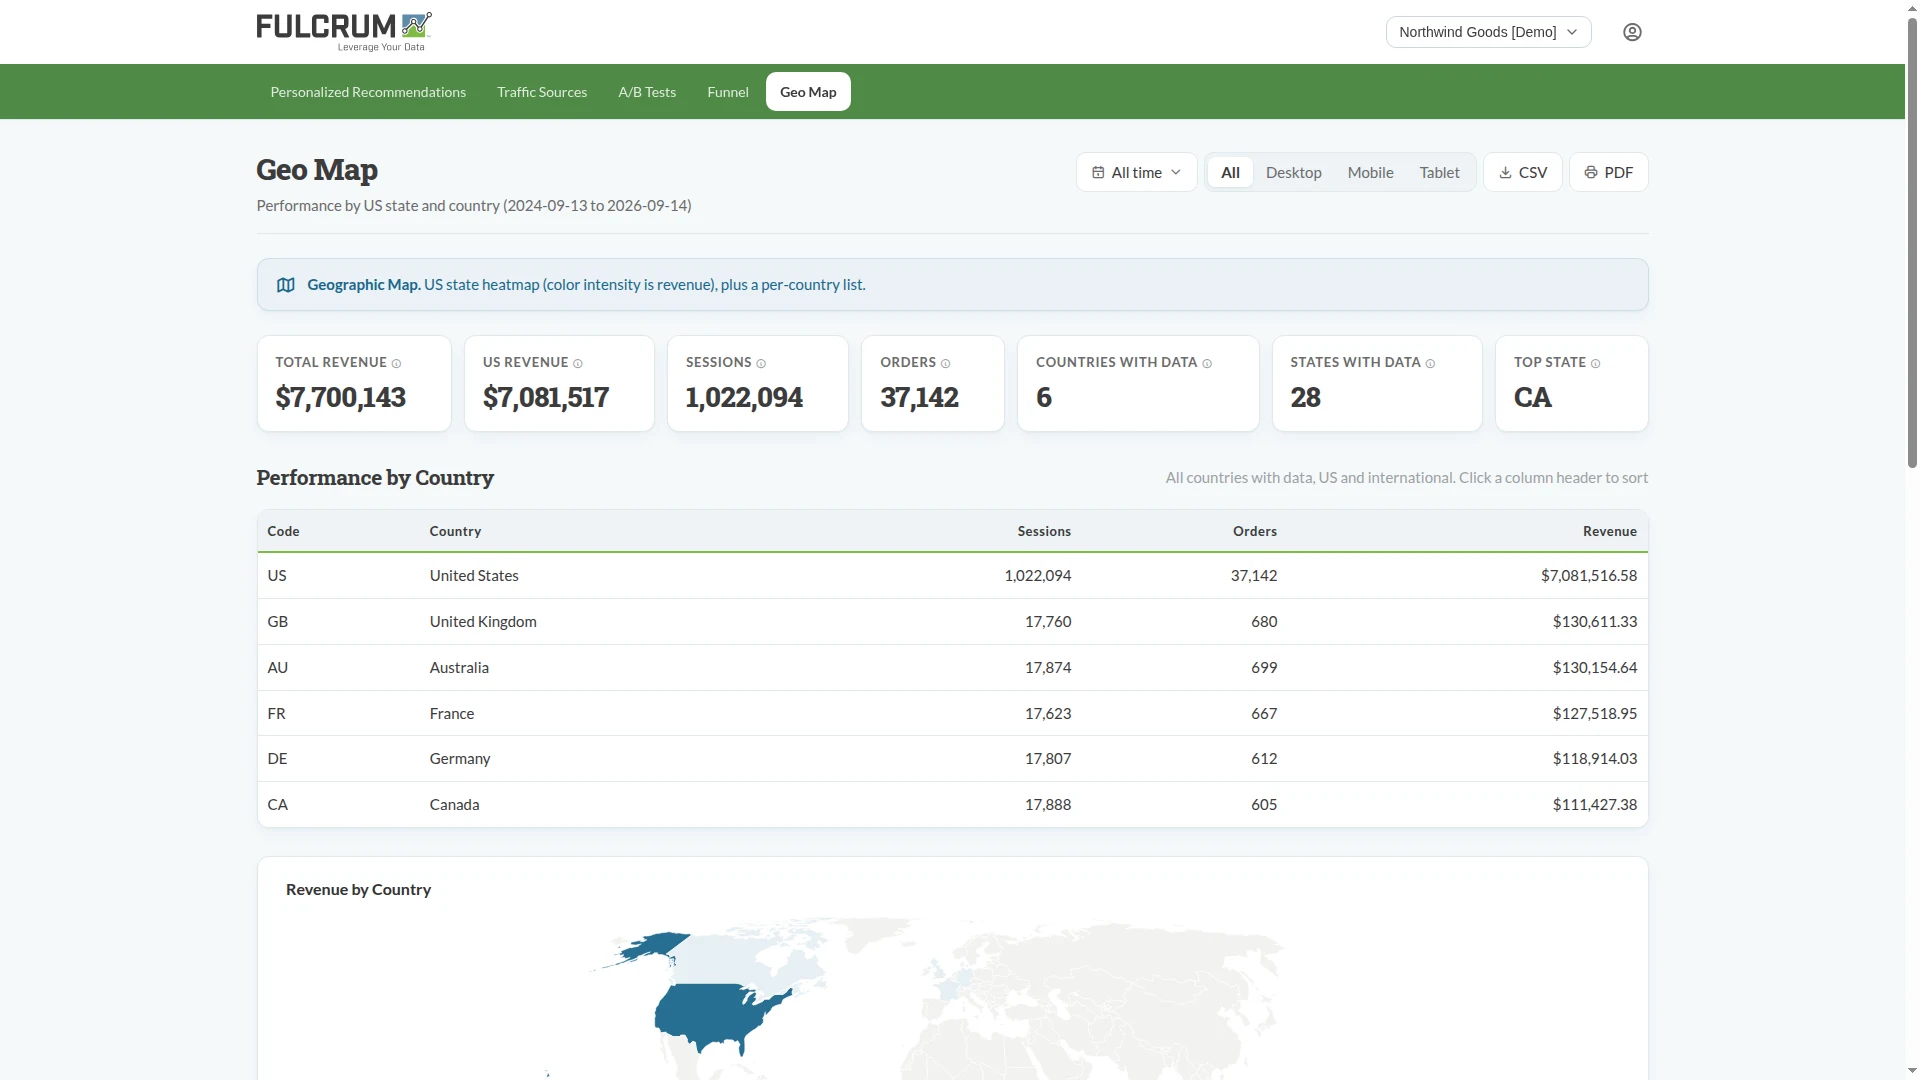 Geo Map
View larger
Geo Map
View larger
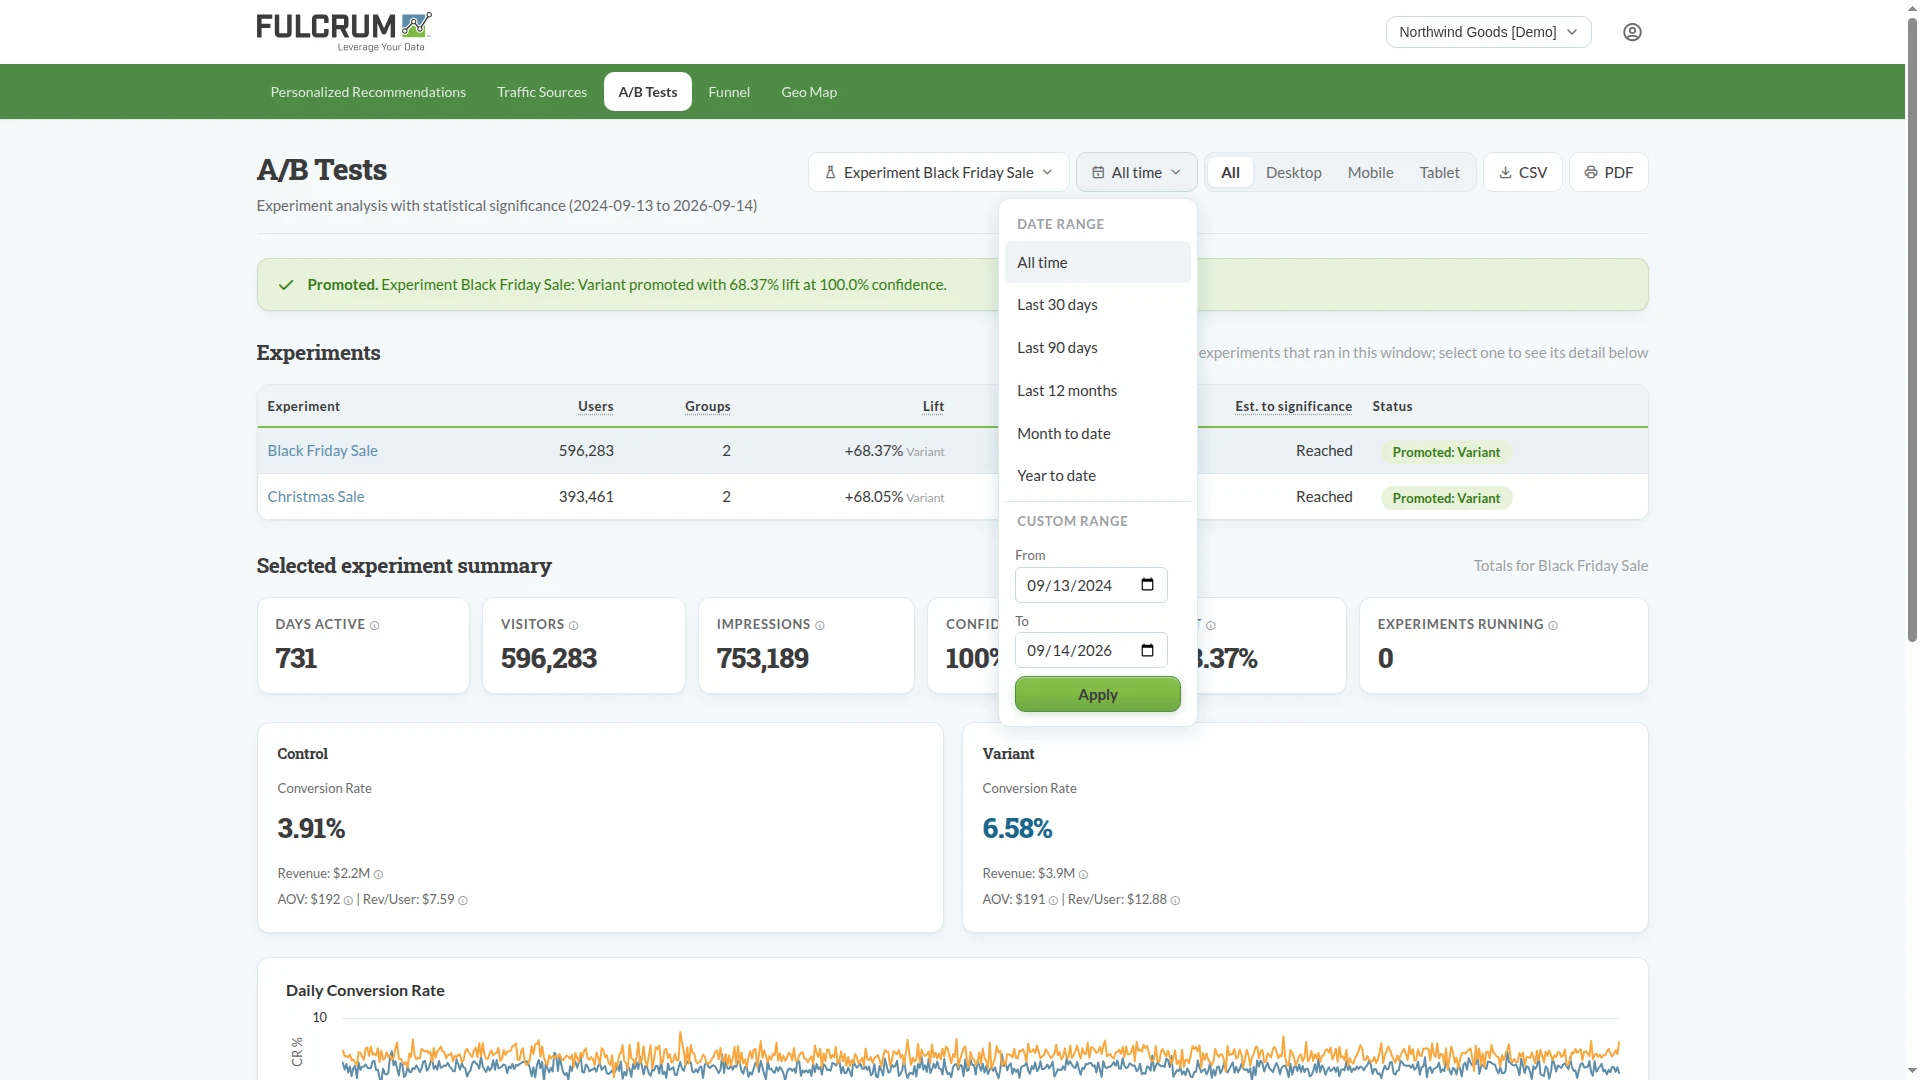 Filters and export
View larger
Filters and export
View larger
Dashboard screenshots use demo account data for illustration.
Delivered on a schedule
Alongside the live dashboard, Fulcrum sends a regular performance report by email - a clear summary of the results personalization is driving on your site. Looking for something different? Custom reports are available on request.
No login required - your report arrives on a set schedule with no action needed on your end.
A clean summary format you can forward to your team or leadership without any cleanup.
Need a different cut of the data? Ask, and Fulcrum will build it.
Live demo
The instance runs with demo data and is a full replication of a real production dashboard.
Test credentials
demo.fulcrumsaas.comdemo@fulcrumsaas.comfulcrumOnce you activate your pilot you have immediate access to all your performance data.
Start Your Free 45 Day Pilot